Big Gains In November Steal From Santa
What a month November was! Here are some of the highlights:
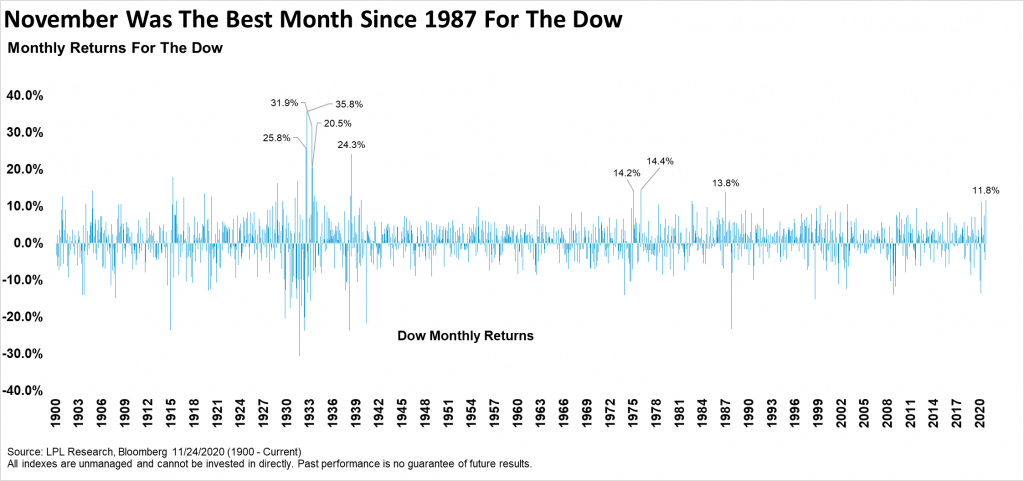
- Best month for Dow since January 1987 (11.9%) and best November since 1928
- Best month ever for the STOXX 600 (16.7%)
- Best month ever for the Russell 2000 (18.3%)
- Best month for the S&P 500 (10.8%) and Nasdaq (11.8%) since April 2020
- Best month for Dow Transports since October 2011 (12.1%)
- Best month from PHLX Semiconductor Index since March 2003 (18.4%)
- Best month for Industrials (16.0%) and Financials (16.8%) since April 2009
- Second best month ever for energy (28.0%)*
“A way better than expected earnings season, a likely split Congress, and major breakthroughs on the vaccine front all helped stocks soar last month,” explained LPL Financial Chief Market Strategist Ryan Detrick. “Add ongoing support from the Federal Reserve as the cherry on top and we are looking at a truly historic month on many levels.”
Here’s all the Dow monthly returns since 1990. Last month was the best return since January 1987. Now before you go out and sell because you see 1987, remember the S&P 500 added another 20% the seven months after the huge gains in early 1987.

View enlarged chart.
It was the best November for the S&P 500 since November 1928.

View enlarged chart.
Small caps soared on the likelihood of taxes staying lower due to a divided Congress and vaccine progress, with the Russell 2000 adding more than 18% for the best month ever, topping the previous record from February 2000.

View enlarged chart.
What happens after a big month? Well, history says a 10% monthly gain is quite bullish. In fact, we had a 10% plus rally back in April 2020 and shared this same chart at that time. Sure enough, returns have been strong this time around as well. “The bottom line is the huge gains in November could actually be the start of something much stronger,” according to Ryan Detrick. “Also, this was the second month of 2020 with a 10% gain. The only other year to do that? 1982, which kicked off a historic bull market.”

View enlarged chart.
Turning to December, this month is widely known to be quite bullish, as Santa comes to town, people feel good, and stocks tend to do well. As shown in the LPL Chart of the Day, since 1950, December has been the second best month of the year, with only November better. December had been the best month of the year until the historic 9.2% drop in 2018. As a result, December hasn’t been quite as strong over the past 10 and 20 years.

View enlarged chart.
Breaking it down even more, a big rally in November can potentially steal some of December’s thunder. As after a 5% or 10% rally in November, the returns in December are more muted. The flipside to this though is if the S&P 500 is up more than 10% for the year (like 2020), then stocks have benefited from some performance chasing and have tended to do better.

View enlarged chart.
What does it all mean? After the historic move in November we wouldn’t be surprised to see below average returns in December. We do believe this is a new bull market and lasting economic cycle of growth, but overall sentiment is getting quite stretched and this increases the potential for some near-term weakness. Please read COVID-19 May Threaten The Economic Recovey for more of our near-term thoughts.
IMPORTANT DISCLOSURES
This material is for general information only and is not intended to provide specific advice or recommendations for any individual. There is no assurance that the views or strategies discussed are suitable for all investors or will yield positive outcomes. Investing involves risks including possible loss of principal. Any economic forecasts set forth may not develop as predicted and are subject to change.
References to markets, asset classes, and sectors are generally regarding the corresponding market index. Indexes are unmanaged statistical composites and cannot be invested into directly. Index performance is not indicative of the performance of any investment and do not reflect fees, expenses, or sales charges. All performance referenced is historical and is no guarantee of future results.
Any company names noted herein are for educational purposes only and not an indication of trading intent or a solicitation of their products or services. LPL Financial doesn’t provide research on individual equities. All information is believed to be from reliable sources; however, LPL Financial makes no representation as to its completeness or accuracy.
All index and market data from FactSet and MarketWatch.
This Research material was prepared by LPL Financial, LLC.
Securities and advisory services offered through LPL Financial (LPL), a registered investment advisor and broker-dealer (member FINRA/SIPC).
Insurance products are offered through LPL or its licensed affiliates. To the extent you are receiving investment advice from a separately registered independent investment advisor that is not an LPL affiliate, please note LPL makes no representation with respect to such entity.
- Not Insured by FDIC/NCUA or Any Other Government Agency
- Not Bank/Credit Union Guaranteed
- Not Bank/Credit Union Deposits or Obligations
- May Lose Value
For Public Use – Tracking 1-05039378